2024-11-17 Setting Up A Monitoring Suite

I installed Uptime Kuma and Beszel previously. They are running well. Here I am going to try a suite of tools for logs and metrics monitoring. For logging I'll use Promtail, Loki, and Grafana. For metrics, I'll try both the NodeExporter/Prometheus and Telegraf/InfluxDB suites with Grafana. Exploring them is my first step towards more detailed application monitoring.
I investigated a little in this monitoring landscape. Of course there will be a lot of competing tools and technologies, with overlaps between them that need to be sorted out. These particular tools such as Grafana, Loki, Promtail, Prometheus, Node Exporter, Telegraf, and InfluxDB are widely sued with strong support. They all need some time and effort to learn and experiment with. But it will be a good opportunity to appreciate the works in this landscape.
Installation
I actually played with these tools, following their get started guides:
- To install Loki with Docker Compose, check the installation guide, which also contains starter configurations for Grafana and Promtail
- To install InfluxDB with Docker Compose, visit the guide. There is also this guide from the company InfluxData that also contains information about Telegraf installation.
- To install Prometheus and Node Exporter, this guide from Grafana contains a Docker Compose file with all the three services.
Of course there are a lot of information on the web in different flavors. For me I like to start and stop services using docker-compose.yaml as a unit, so here I just create a folder for each of the containers:
Grafana
To install Grafana, first create the folder:
mkdir grafana
cd grafana
To install Grafana, I just check the Loki nstallation guide and get the reference docker-compose.yaml as suggested:
wget https://raw.githubusercontent.com/grafana/loki/v3.0.0/production/docker-compose.yaml -O docker-compose.yamland create docker-compose.yaml with the Grafana part only:
networks:
  monitoring:
    name: monitoring

services:
  grafana:
    restart: unless-stopped
    image: grafana/grafana:latest
    container_name: grafana
    user: '1000'
    environment:
      - GF_PATHS_PROVISIONING=/etc/grafana/provisioning
      - GF_AUTH_ANONYMOUS_ENABLED=true
      - GF_AUTH_ANONYMOUS_ORG_ROLE=Admin
    volumes:
      - ./data:/var/lib/grafana
    ports:
      - "3000:3000"
    networks:
      - monitoring
We will use a new network monitoring for Grafana and other tools discussed here.Trying to launch the container, docker compose up -d will show permission errors. Just change the owner of the created folder data to the current user, whose UID is 1000 obtained from the command id -u.
sudo chown <user id>:<user id> dataOr later if starting over, create the data folder with proper owner and permissions in advance.
After trying various container installations, we get a feel about how to adjust user and folder permissions for different containers. When getting real, one should look at the information for each container, which user and group it operates on, and map them to host machine properly. It is encouraged not to run containers with superuser privileges.
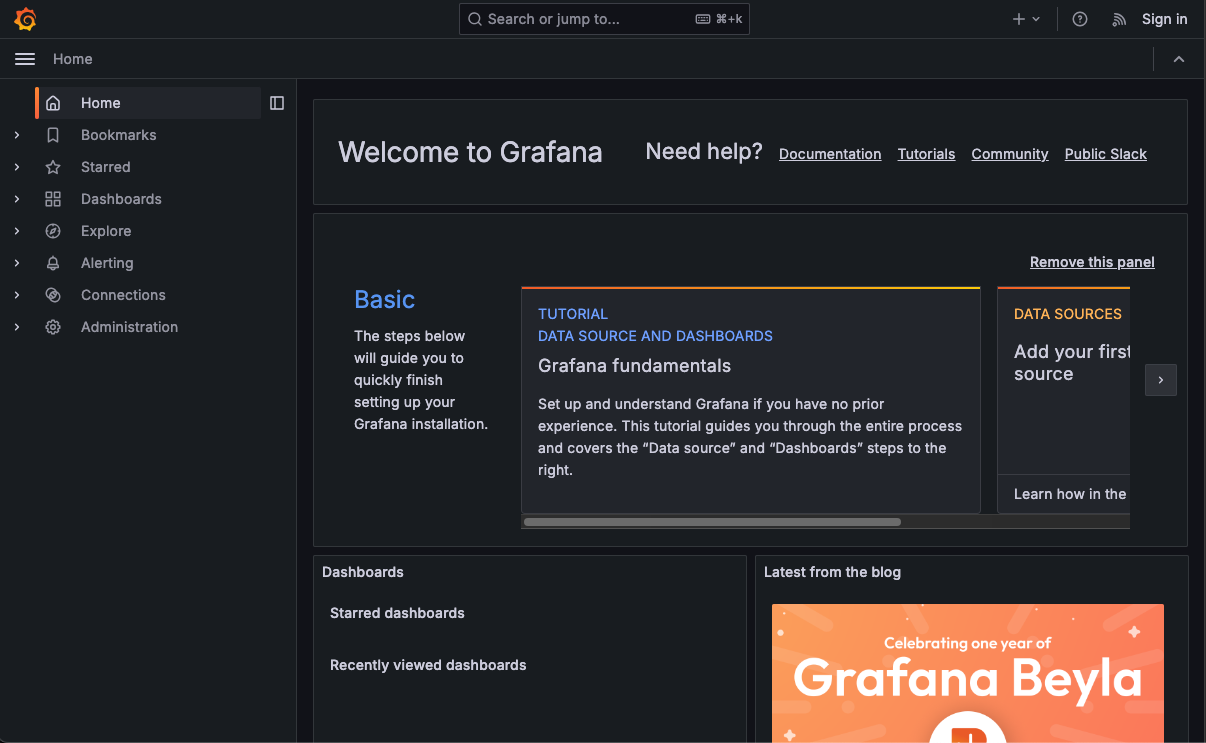
Launch the container again and visit the site http://192.168.x.x:3000, assuming it is on a local LAN.
Loki
Create another folder (next to grafana)
mkdir loki
cd loki
and the docker-compose.yaml based on the same downloaded file:
networks:
  monitoring:
    name: monitoring
    external: true

services:
  loki:
    restart: unless-stopped
    image: grafana/loki:latest
    container_name: loki
    ports:
      - "3100:3100"
    command: -config.file=/etc/loki/local-config.yaml
    networks:
      - monitoring
Launch the container and shell into it, we can look at the configuration file at /etc/loki/local-config.yaml.
auth_enabled: false

server:
  http_listen_port: 3100

common:
  instance_addr: 127.0.0.1
  path_prefix: /loki
  storage:
    filesystem:
      chunks_directory: /loki/chunks
      rules_directory: /loki/rules
  replication_factor: 1
  ring:
    kvstore:
      store: inmemory

schema_config:
  configs:
    - from: 2020-10-24
      store: tsdb
      object_store: filesystem
      schema: v13
      index:
        prefix: index_
        period: 24h

ruler:
  alertmanager_url: http://localhost:9093
We'll create a file ./conf/local-config.yaml on current folder with the same content, as we want to make it persistent and configurable later. Modify docker-compose.yaml as:
services:
  loki:
    restart: unless-stopped
    image: grafana/loki:latest
    container_name: loki
    ports:
      - "3100:3100"
    volumes:
      - ./conf/loki:/etc/loki
    command: -config.file=/etc/loki/local-config.yaml
    networks:
      - monitoring
Check if the service is ready by visiting http://192.168.x.x:3100/ready, assuming the host is at 192.168.x.x. You may have to wait a bit for it to reply ready.
Promtail
Now turn to Promtail. Following the same practice, create a folder:
mkdir promtail
cd promtail
The docker-compose.yaml looks like:
networks:
  monitoring:
    name: monitoring
    external: true

services:
  promtail:
    restart: unless-stopped
    image: grafana/promtail:latest
    container_name: promtail
    volumes:
      - /var/log:/var/log
      - /var/run/docker.sock:/var/run/docker.sock
    command: -config.file=/etc/promtail/config.yml
    networks:
      - monitoring
Launch the container and shell into it (docker-compose exec -it promtail bash) and see what does the configuration file look like (in /etc/promtail):
server:
  http_listen_port: 9080
  grpc_listen_port: 0

positions:
  filename: /tmp/positions.yaml

clients:
  - url: http://loki:3100/loki/api/v1/push

scrape_configs:
- job_name: system
  static_configs:
  - targets:
      - localhost
    labels:
      job: varlogs
      __path__: /var/log/*log
It seems by default Promtail already uses http://loki:3100 as one of its clients, so we don't have to change it. Like the case for Loki, create a file at ./conf/config.yml with the same content as above, and change the docker-compose.yaml to mount the folder:
...
  promtail:
    ...
    volumes:
      - /var/log:/var/log
      - /var/run/docker.sock:/var/run/docker.sock
      - ./conf:/etc/promtail
    command: -config.file=/etc/promtail/config.yml
    ...
Launch the container again. If there are some errors about "Ingestion rate limit exceeded," you can increase the rate limit for Loki. In Loki's configuration file, add the following section and restart both:
limits_config:
  ingestion_rate_mb: 16
  ingestion_burst_size_mb: 32
You may have to adjust the parameters or search the web for more help.
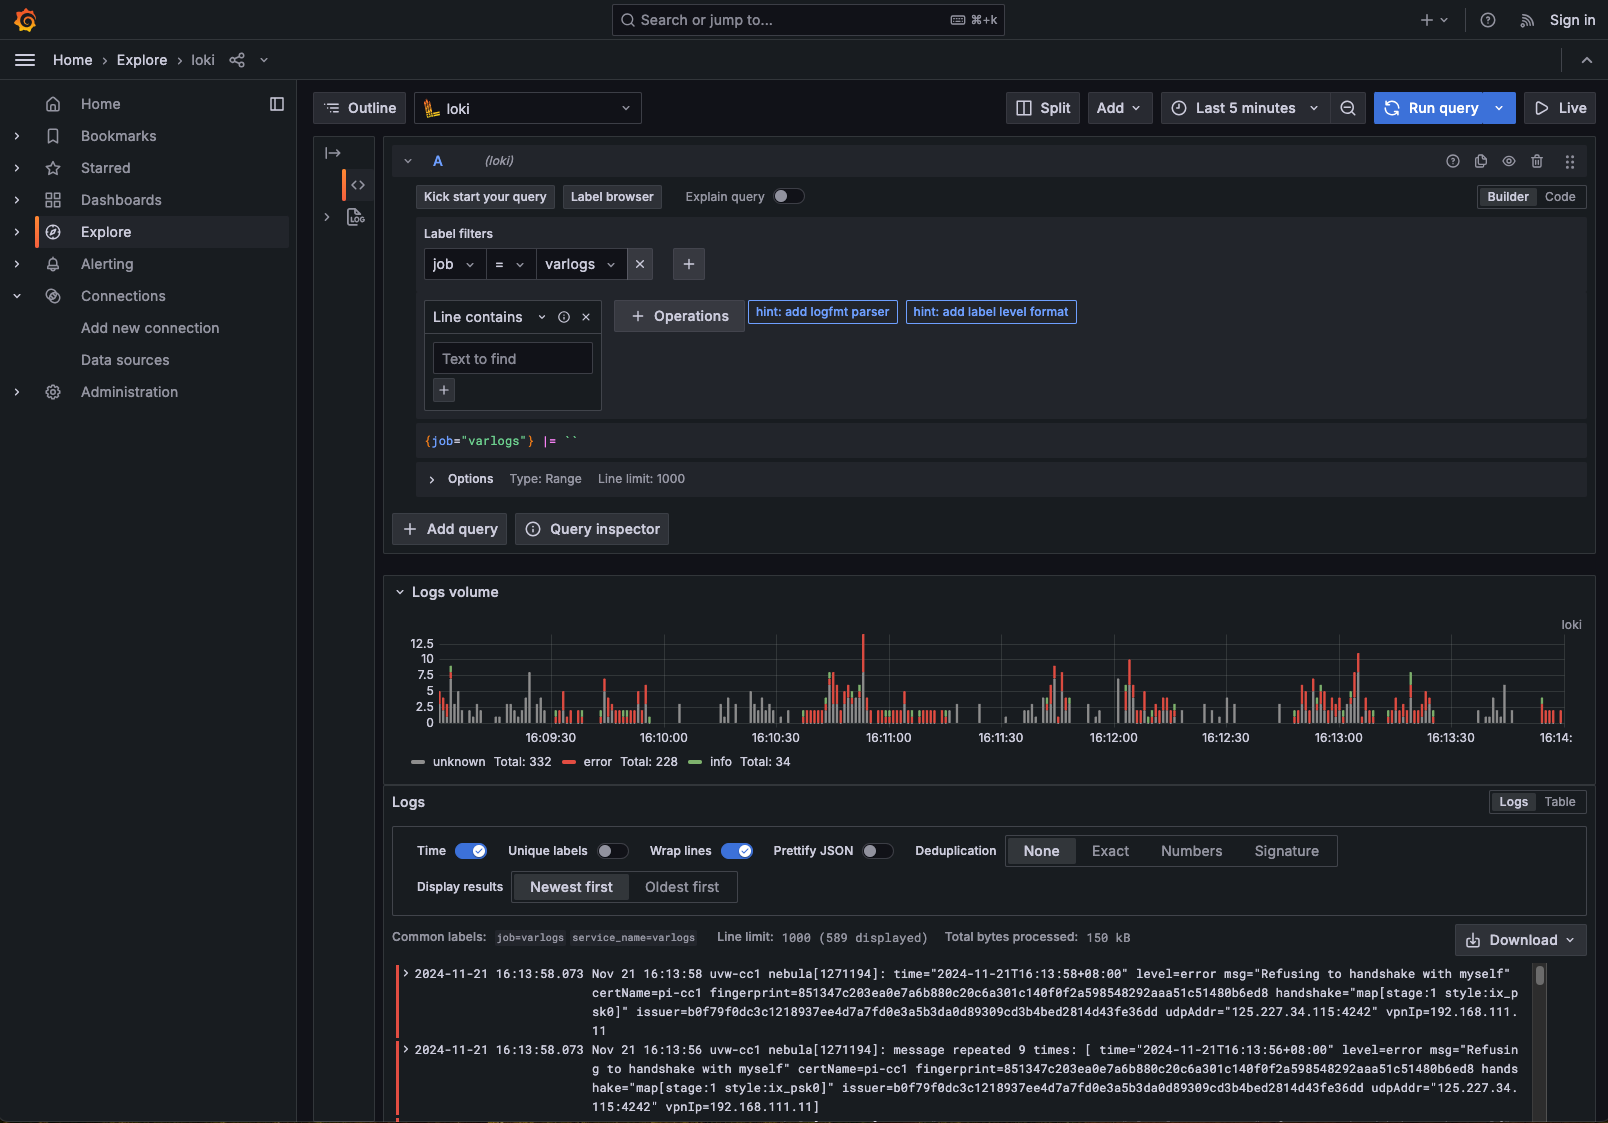
To verify if the setup is working, on Grafana's site, add a new Loci data source (in the Connections page) with the Loki's URL (here http://loki:3100), and click Save and Test to see it connects. If so, go to Explore page, select the Loki data source, in the Label filters, select job for the label and varlogs for as the value, and see of results come out:
Prometheus and Node Exporter
To install Prometheus with Docker, the official page is here, but there is no immediate Docker Compose file for reference (although adapting the docker command is simple). For Node Exporter, the information regarding installation with Docker is here, but it is not recommended to install it as containers. I'd still like to install Node Exporter as a Docker container for now. Later if needed I can always install it on the host.
I just borrow the compose file from Grafana's guide. First create a folder:
mkdir prometheus
cd prometheus
Adapt the docker-compose.yaml there into:
networks:
  monitoring:
    name: monitoring
    external: true

services:
  prometheus:
    restart: unless-stopped
    image: 'prom/prometheus:latest'
    container_name: prometheus
    user: '1000'
    volumes:
      - type: bind
        source: ./conf/prometheus.yml
        target: /etc/prometheus/prometheus.yml
      - ./data:/prometheus
    ports:
      - 9090:9090
    networks:
      - monitoring
Also prepare the minimal configuration file at conf/prometheus.yml:
global:
  scrape_interval: 15s

scrape_configs:
  - job_name: "prometheus"
    static_configs:
    - targets: ["localhost:9090"]
Make sure the file conf/prometheus.yaml and folder data exist with proper owner and permissions. Launch the container and visit http://192.168.x.x:9090, which will redirect to http://192.168.x.x:9090/query.:
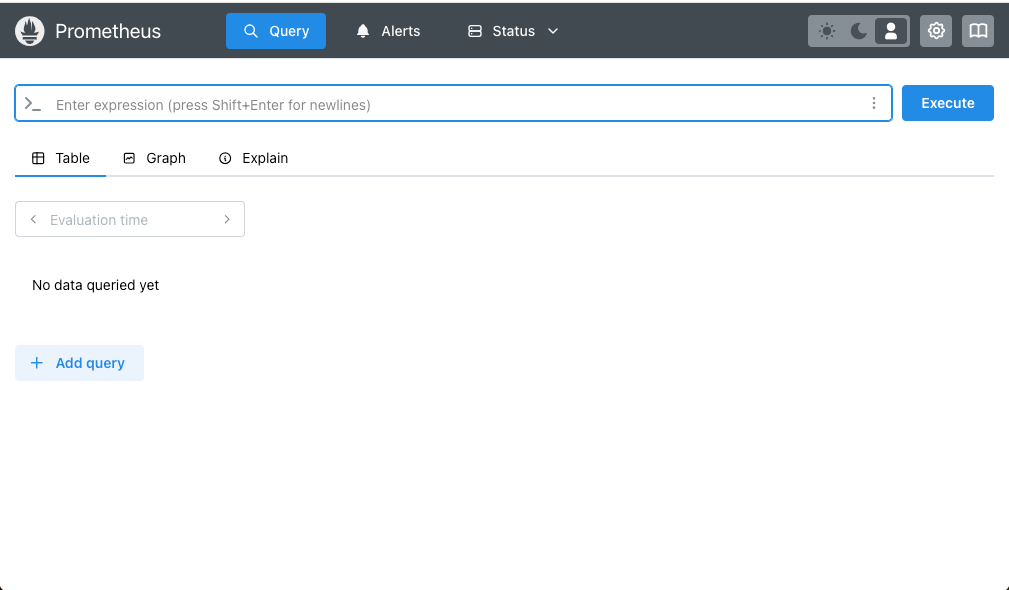
Since Prometheus also exposes its own metrics, you can visit the page http://192.168.x.x:9090/metrics:
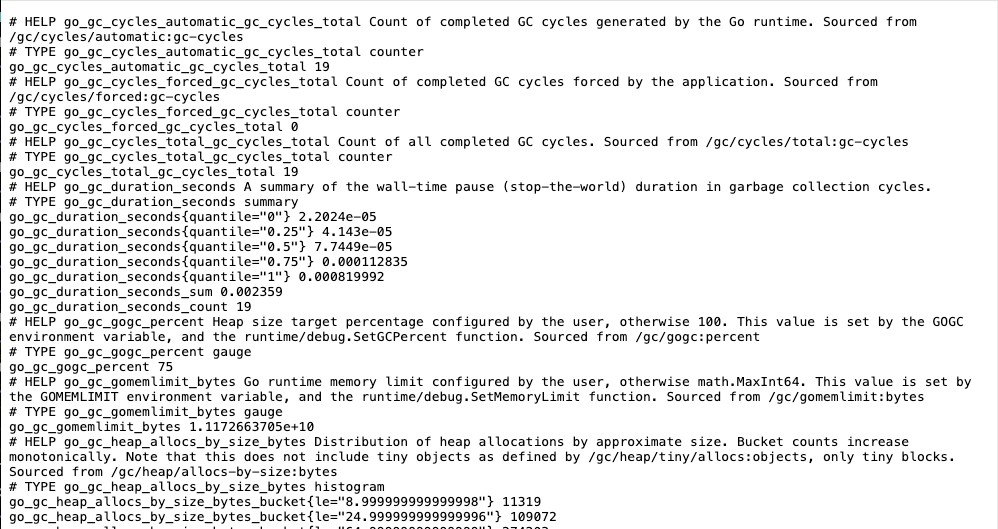
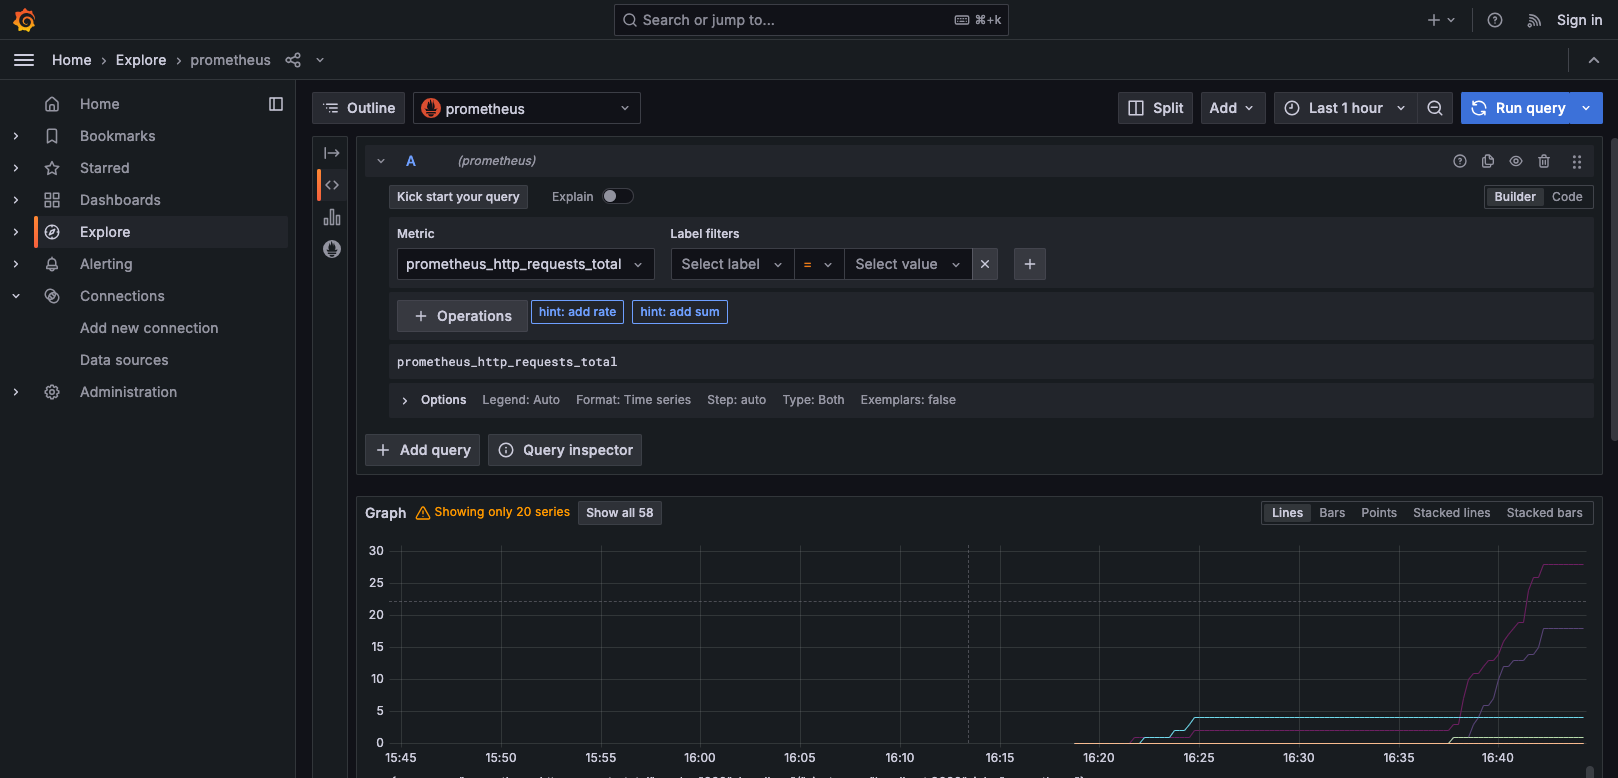
This is the the prometheus job specified in the minimal configuration.Therefore, we can add a new Prometheus data source on the Grafana site. Like adding the Loki data source, select the Prometheus type and enter the URL http://prometheus:9090, and click Save and Test to see if it connects. If so, explore the data by selecting the Prometheus data source, select prometheus_http_requests_total and see if results come out:
Node Exporter
On a separate folder:
mkdir nodeexporter
cd nodeexporter
Create the docker-compose.yaml:
networks:
monitoring:
name: monitoring
external: true
services:
nodeexporter:
restart: unless-stopped
image: prom/node-exporter:latest
container_name: nodeexporter
volumes:
- /proc:/host/proc:ro
- /sys:/host/sys:ro
- /:/rootfs:ro
command:
- '--path.procfs=/host/proc'
- '--path.rootfs=/rootfs'
- '--path.sysfs=/host/sys'
- '--collector.filesystem.mount-points-exclude=^/(sys|proc|dev|host|etc)($$|/)'
ports:
- 9100:9100
networks:
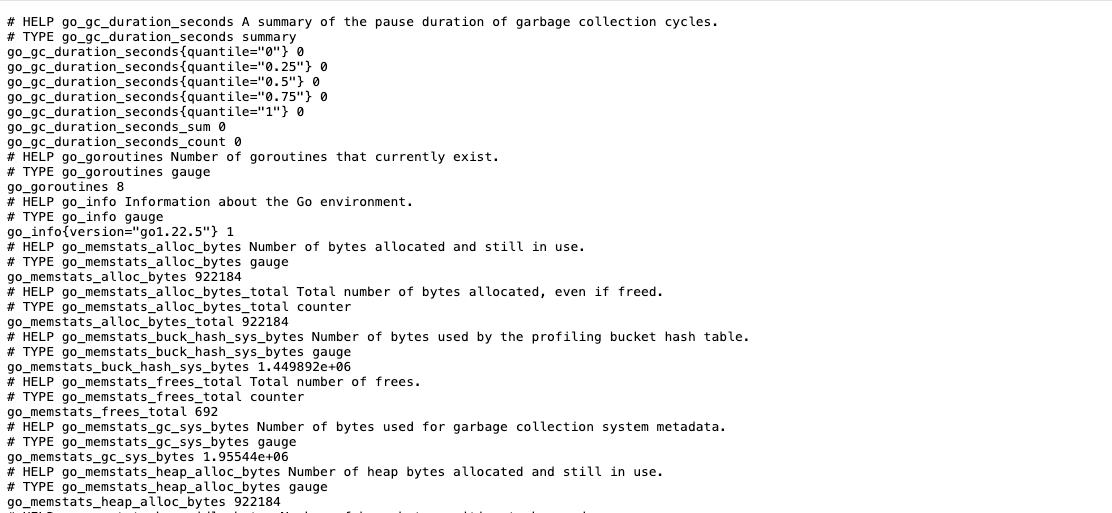
- monitoringVisit the site http://192.168.x.x:9100 to see if the site is up. We can also check its metrics URL at http://192.168.x.x:9100/metrics :
Accordingly, We can modify Prometheus's configuration by adding the new entry to include the new scrape "target":
global:
scrape_interval: 15s
scrape_configs:
- job_name: "prometheus"
static_configs:
- targets: ["localhost:9090"]
- job_name: "node_self"
scrape_interval: 10s
static_configs:
- targets:
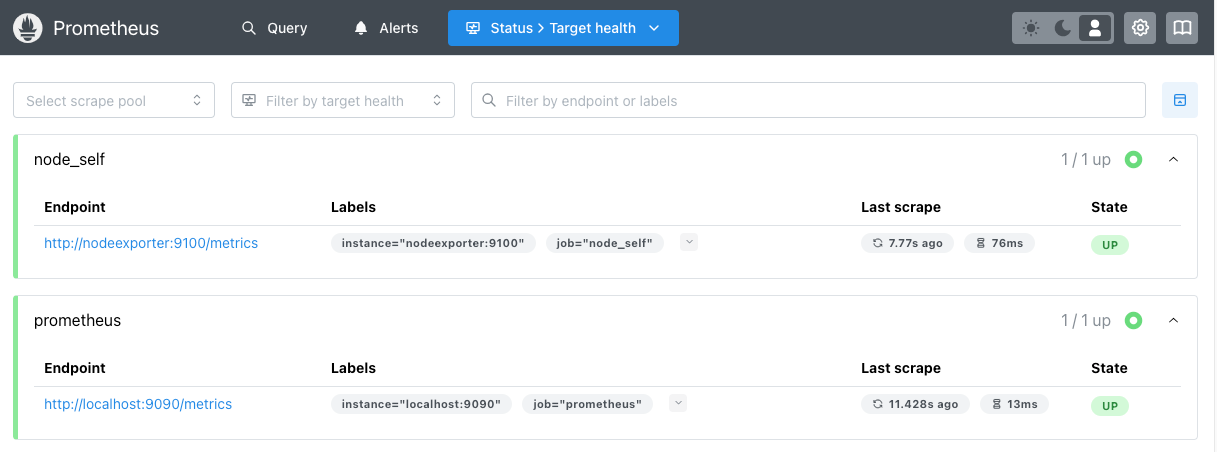
- "nodeexporter:9100"Re-launch Prometheus again. We can check if Node Exporter is connected with Prometheus by visiting the page http://192.168.x.x:9090/targets (or click Status / Target health)
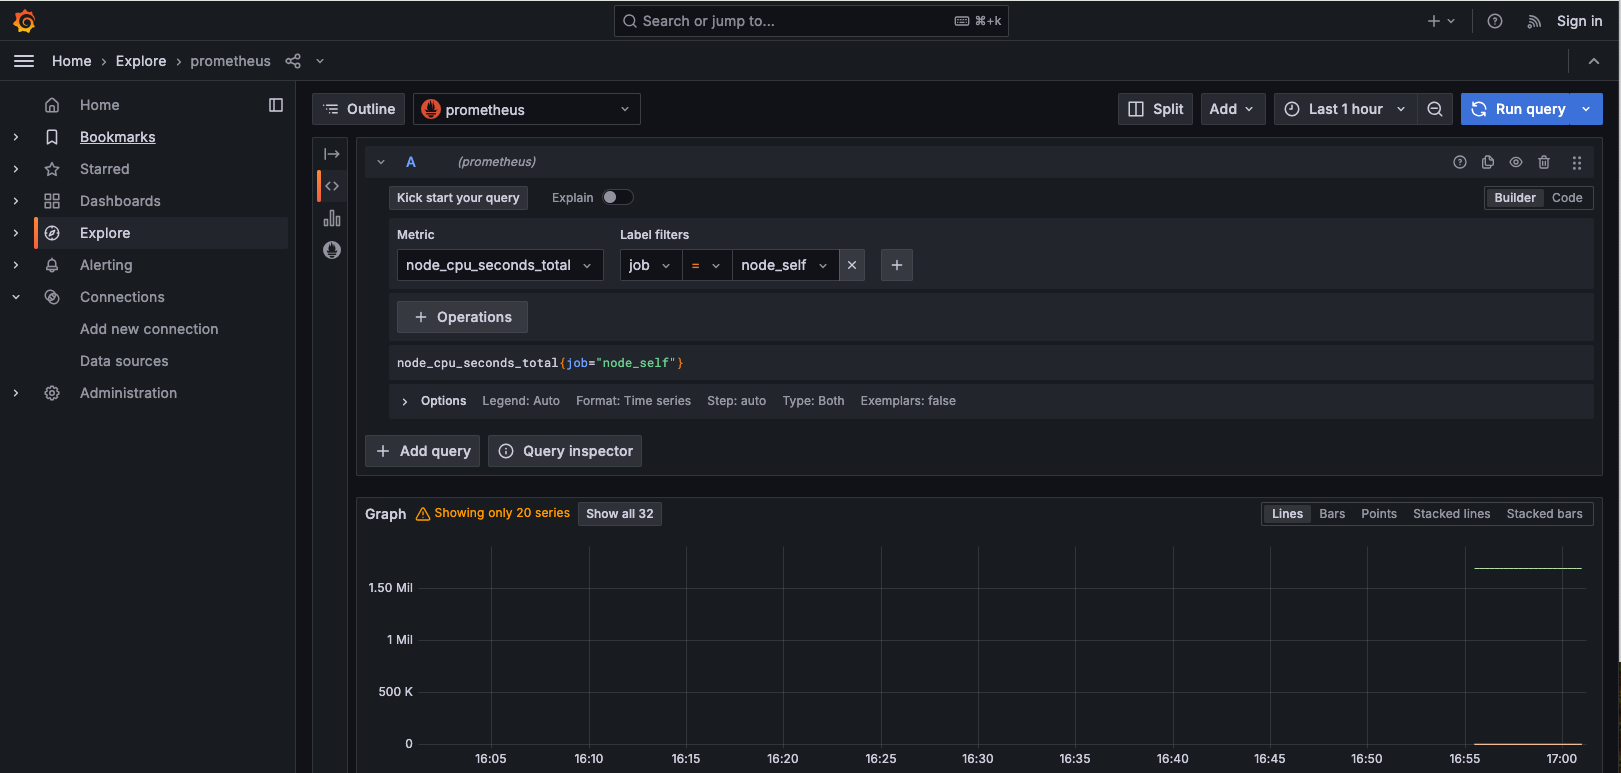
On Grafana we can also explore the data. With the Prometheus data source, select metrics node_cpu_seconds_toatal , and also select job as the label and node_self as the value to see if results show up:
InfluxDB
As mentioned previously, this guide from InfluxData discusses the installation of InfluxDB and Telegraf. First create the folder:
mkdir influxdb
cd influxdb
Since there is no immediate official docker-compose.yaml, let's try the CLI approach indicated there. Create the initial docker-compose.yaml:
networks:
  monitoring:
    name: monitoring
    external: true

services:
  influxdb:
    restart: unless-stopped
    image: influxdb:2-alpine
    container_name: influxdb
    user: '1000'
    ports:
      - "8086:8086"
    volumes:
      - ./data:/var/lib/influxdb2:rw
      - ./conf:/etc/influxdb2:rw
    networks:
      - monitoring
For this work, prepare the conf and data folder with proper owner and permissions like before.
Launch the container to see if it is up. If successful, run the setup command:
$ docker-compose up -d
$ docker compose exec -it influxdb influx setup
? Please type your primary username jy
? Please type your password ***********
? Please type your password again ***********
? Please type your primary organization name Pointegrity
? Please type your primary bucket name homelab
? Please type your retention period in hours, or 0 for infinite 168
? Setup with these parameters?
Username: jy
Organization: Pointegrity
Bucket: homelab
Retention Period: 168h0m0s
Yes
User Organization Bucket
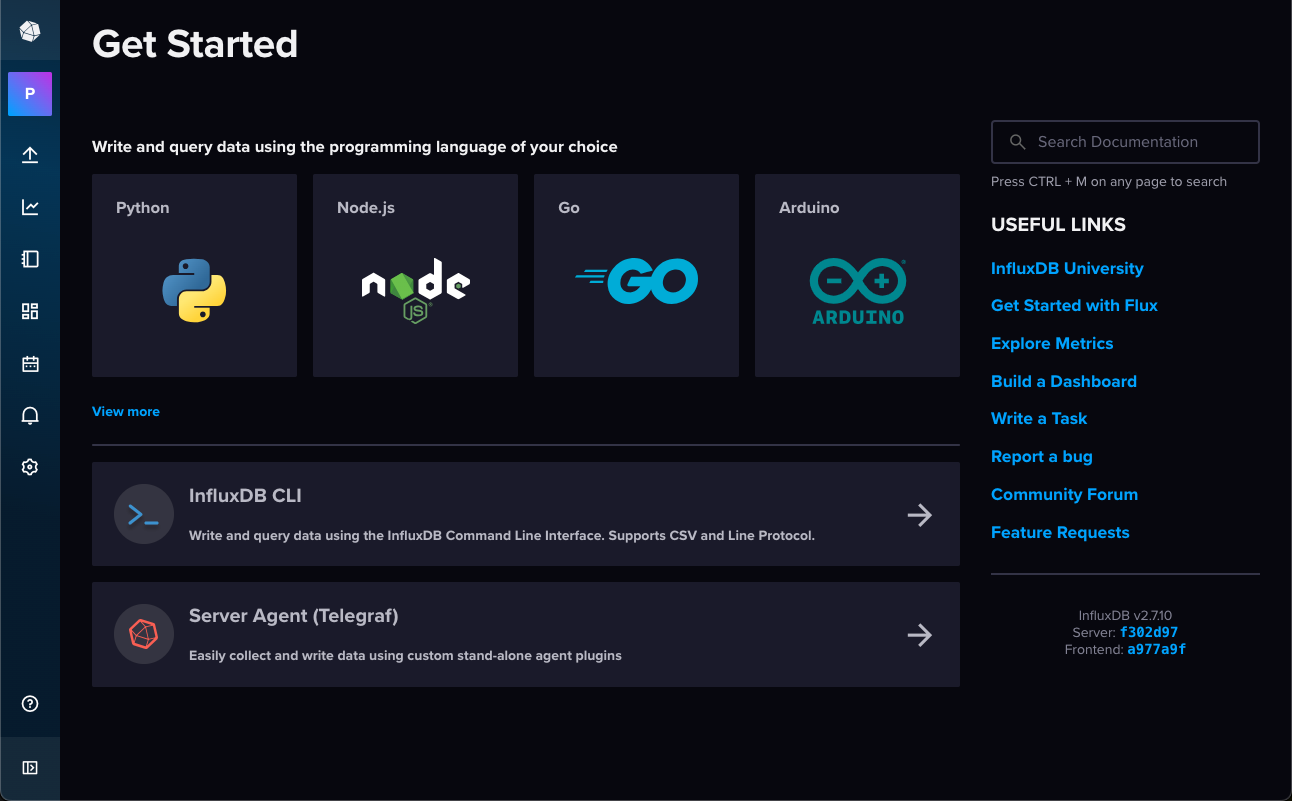
jy Pointegrity homelabVisit the site http://192.168.x.x:8086 (assuming on a local LAN):
Looking at the folder ./conf we see a generated configuration file ./conf/local-configs.
Telegraf
To install Telegraf, create a folder:
mkdir telegraf
cd telegraf
And create a docker-compose.yaml:
networks:
  monitoring:
    name: monitoring
    external: true

services:
  telegraf:
    restart: unless-stopped
    image: telegraf:alpine
    container_name: telegraf
    user: "1000"
    volumes:
      - ./conf/telegraf.conf:/etc/telegraf/telegraf.conf:ro
      - /var/run/docker.sock:/var/run/docker.sock:ro
    networks:
      - monitoring
According to the guide, to setup Telegraf, we need to create a configuration file telegraf.conf inside the local folder ./conf:
[[outputs.influxdb_v2]]
## The URLs of the InfluxDB cluster nodes.
##
## Multiple URLs can be specified for a single cluster, only ONE of the
## urls will be written to each interval.
## urls exp: http://127.0.0.1:8086
urls = ["http://influxdb:8086"]

## Token for authentication.
token = "..."

## Organization is the name of the organization you wish to write to; must exist.
organization = "Pointegrity"

## Destination bucket to write into.
bucket = "homelab"
where the token needs to be generated from InfluxDB.
Unfortunately error messages show up when launching the container. The configuration file is not sufficient. So based on this, we create a more complete configuration file:
$ docker-compose exec -it telegraf config > conf/telegraf.confAlso set the file owner and permissions right, such as
sudo chown -R <user>:<user> conf/telegraf
Also protect the telegraf.conf file, which contains tokens. Launch the container and see if it's working.
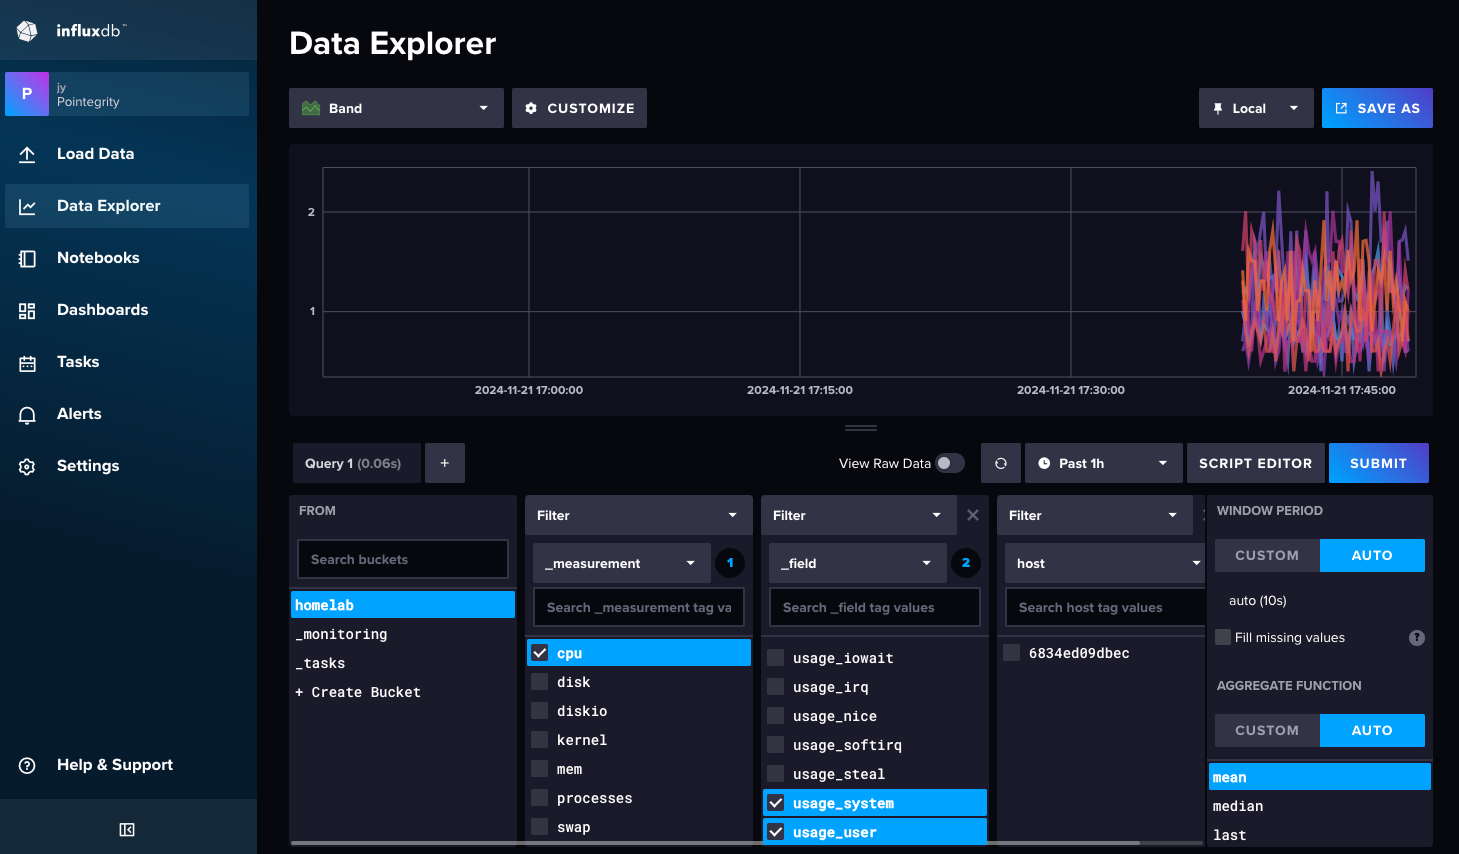
To see if Telegraf connects InfluxDB, open InfluxDB, in Data Explorer, select homelab (or the bucket name you choose), cpu, usage_system and Submit to see if data show up.
To connect Grafana with InfluxDB, also generate an API token on the Load Data page (with All access API token), then on Grafana, add a new data source with
- InfluxDB type,
- Flux query language,
- The organization, the generated API token from InfluxDB, and the bucket
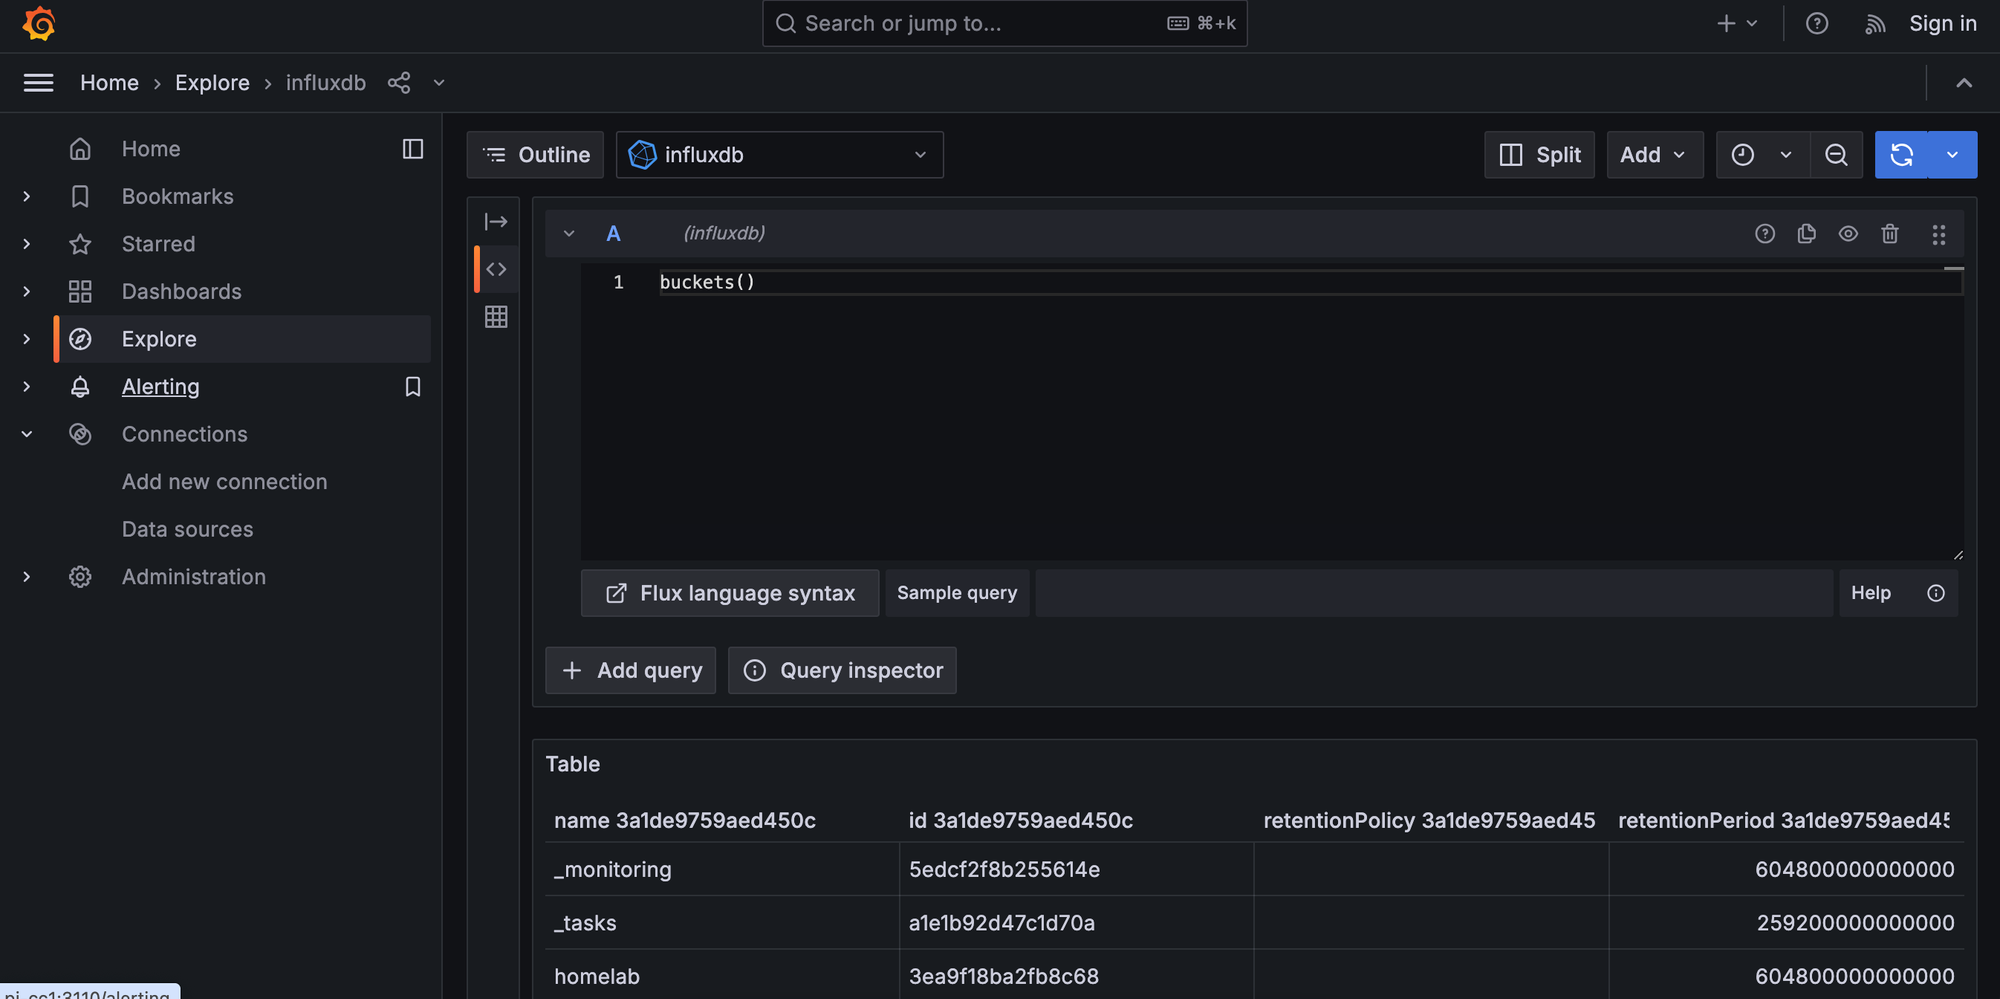
Click Sav and Test to see if it connects correctly, then Explore Data by choosing the influxdb data source, and use the Sample query to query for some data;