2024-11-04 Setting Up Monitoring Tools
I am still in search for suitable monitoring tools for my home lab. I know I can use portainer, but I want to have something that is built for the purpose specifically, observing status more diversely and in depth, and has nice overview dashboard. After some search, I'll try Uptime Kuma and Beszel here.
Background
I tried Checkmk for many hours with the usual official guideline following and web digging but without success. When taking a break, I came to my sense that my goal was to have some simple lightweight tools to monitor my initial set of machines/services. There are a lot to do before I need a full blown system monitoring application logging telemetry infrastructure. So I stopped the drilling and turned my focus on finding simpler and lightweight alternatives.
Uptime Kuma
I want a Docker Compose based toolset with dashboard that can monitor both machine and container/service status without too much setup effort in terms of installation, management, and host/container configuration. It seems Uptime Kuma is quite popular and covers part of the requirements, and I should give it a try.
Search and visit Uptime Kuma's GitHub site. Create the folder:
mkdir uptime-kuma
cd uptime-kuma
Based on the command line docker run -d --restart=always -p 3001:3001 -v uptime-kuma:/app/data --name uptime-kuma louislam/uptime-kuma, create a folder with a docker-compose.yaml accordingly:
networks:
  mynet:
    name: mynet
    external: true

services:
  uptime-kuma:
    image: louislam/uptime-kuma:latest
    container_name: uptime-kuma
    restart: unless-stopped
    volumes:
      - ./data/:/app/data
      - /var/run/docker.sock:/var/run/docker.sock
    ports:
      - 3102:3001
Start the container
docker-compose up -d && docker-compose logs -f
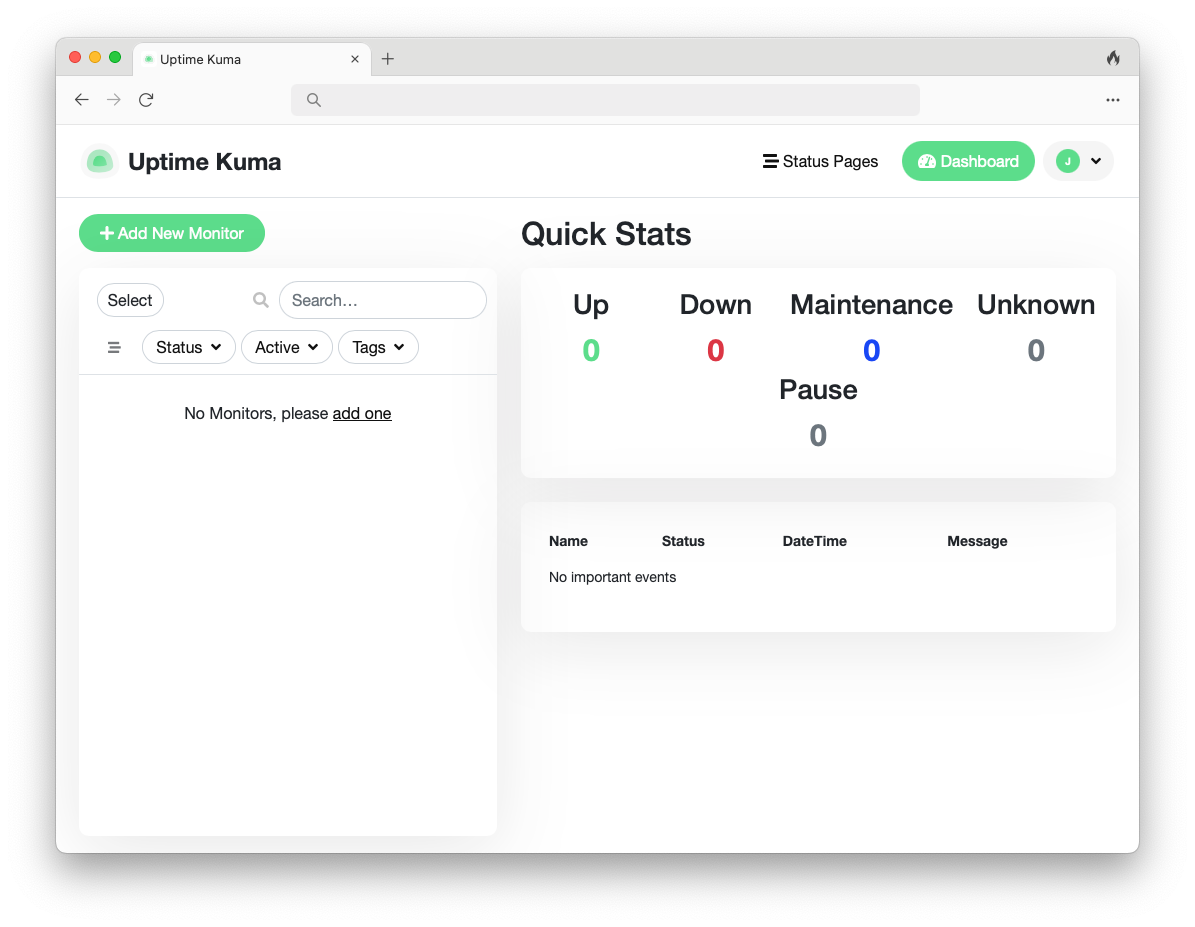
Visiting http://192.168.x.x:3102, we get a login screen. Because the site is in my LAN network I just create the admin account there. If I were to install it on a VPS, I would secure the connection with domain name and HTTPS first. Now I have:
I add this site as the first monitor:
- Monitor Type:
HTTP(s) - Friendly Name:
JY & Posts - URL:
https://jyrobin.com
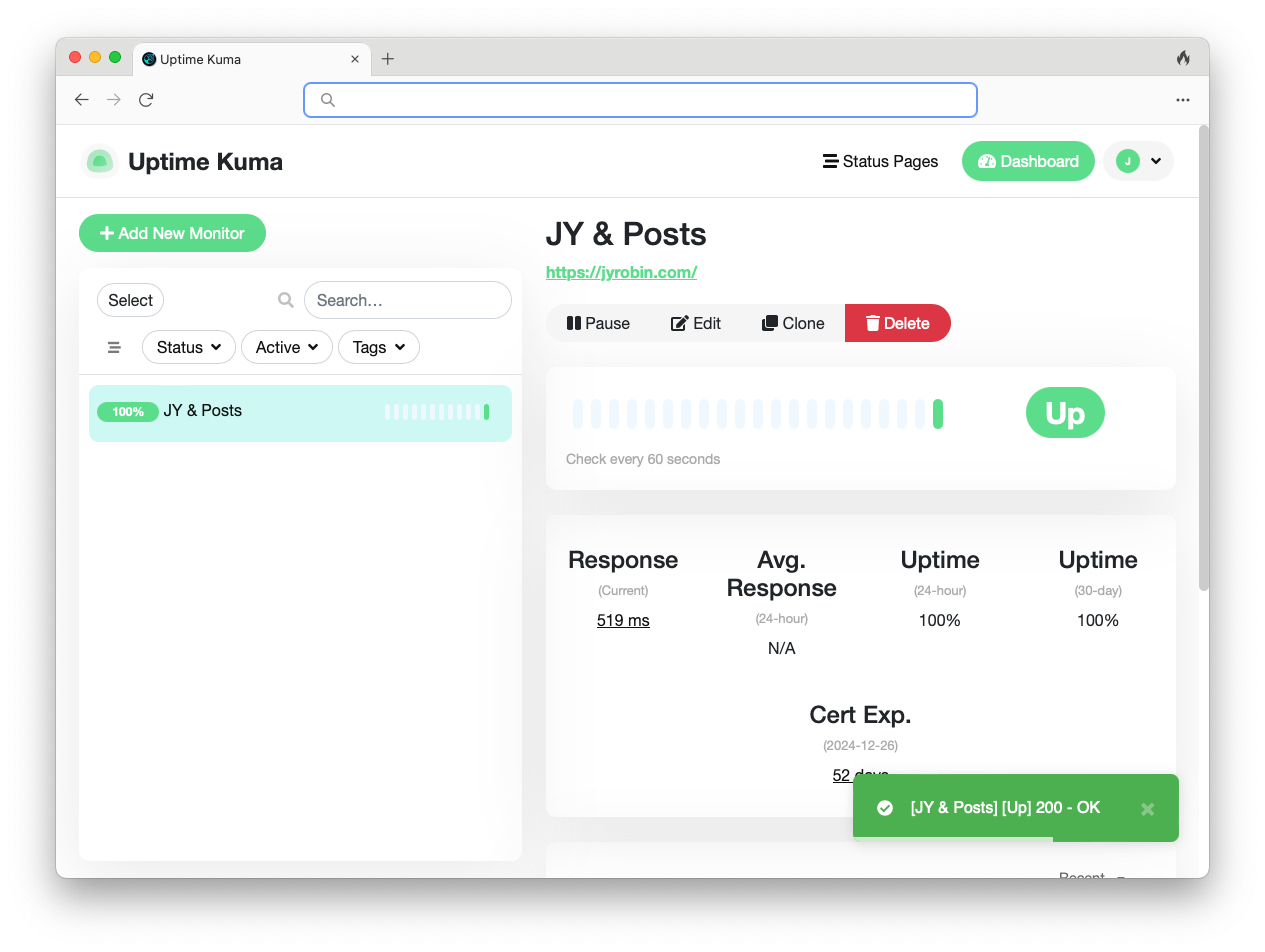
That is straightforward. I can create groups to further organize all the containers to monitor. An important step is to configure notification. I can learn what options out there and what people generally use. For this, I choose the Email option and test it OK.
Beszel
Again I don't want a full tool chain yet that split the works of gathering machine/container status, shipping logs and metrics outwards, aggregating and storing them, then querying and visualizing them from a website. I was looking at Glances, but later decided to try Beszel first. Anyway my goal is to have something as lightweight as possible as long as it is robust enough and actively maintained. When the time comes and I need a more "heavy-weight" toolchain for metrics and application logging, I may still want to keep these tools around instead of retiring them, if they remain handy and lightweight.
Search and visit the installation, create a folder
mkdir beszel
cd beszel
Create the docker-compose.yaml file:
services:
  beszel:
    image: 'henrygd/beszel'
    container_name: 'beszel'
    restart: unless-stopped
    ports:
      - '3103:8090'
    volumes:
      - ./beszel_data:/beszel_data
Launch the container:
docker-compose up -d && docker-compose logs -fand visit the site at 192.168.x.x:3103 after creating the first account:
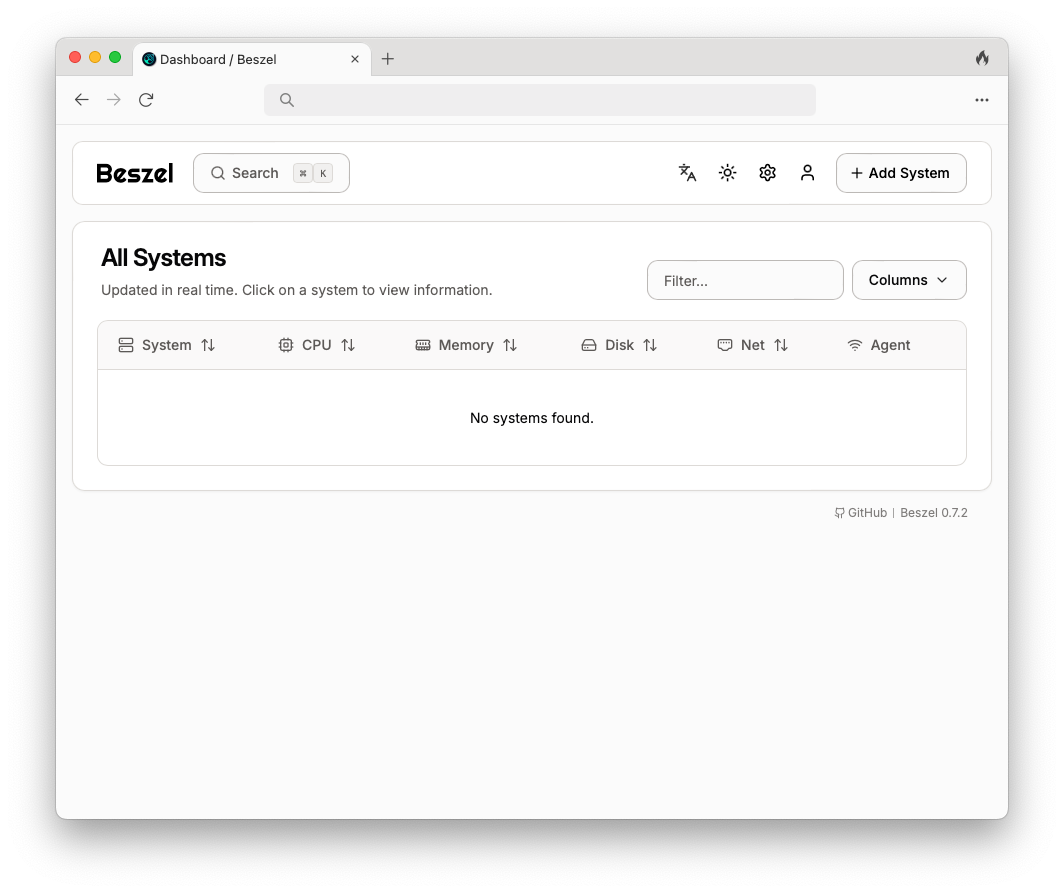
Click the Add System button, fill
- Name:
Local - Host / IP:
192.168.x.x - Port:
45876
Then copy the docker compose content to docker-compose.yaml in a sibling folder:
services:
  beszel-agent:
    image: "henrygd/beszel-agent"
    container_name: "beszel-agent"
    restart: unless-stopped
    network_mode: host
    volumes:
      - /var/run/docker.sock:/var/run/docker.sock:ro
      # monitor other disks / partitions by mounting a folder in /extra-filesystems
      # - /mnt/disk1/.beszel:/extra-filesystems/disk1:ro
    environment:
      PORT: 45876
      KEY: "ssh-ed25519 ..."
Then launch the agent too:
$ docker-compose up -d && docker-compose logs -fBut Beszel is not picking it up. I guess I forgot to open up the firewall for it:
sudo ufw allow from 192.168.x.0/24 to any port 45876
sudo ufw allow from 172.0.0.0/8 to any port 45876
Then I got localhost picked up:
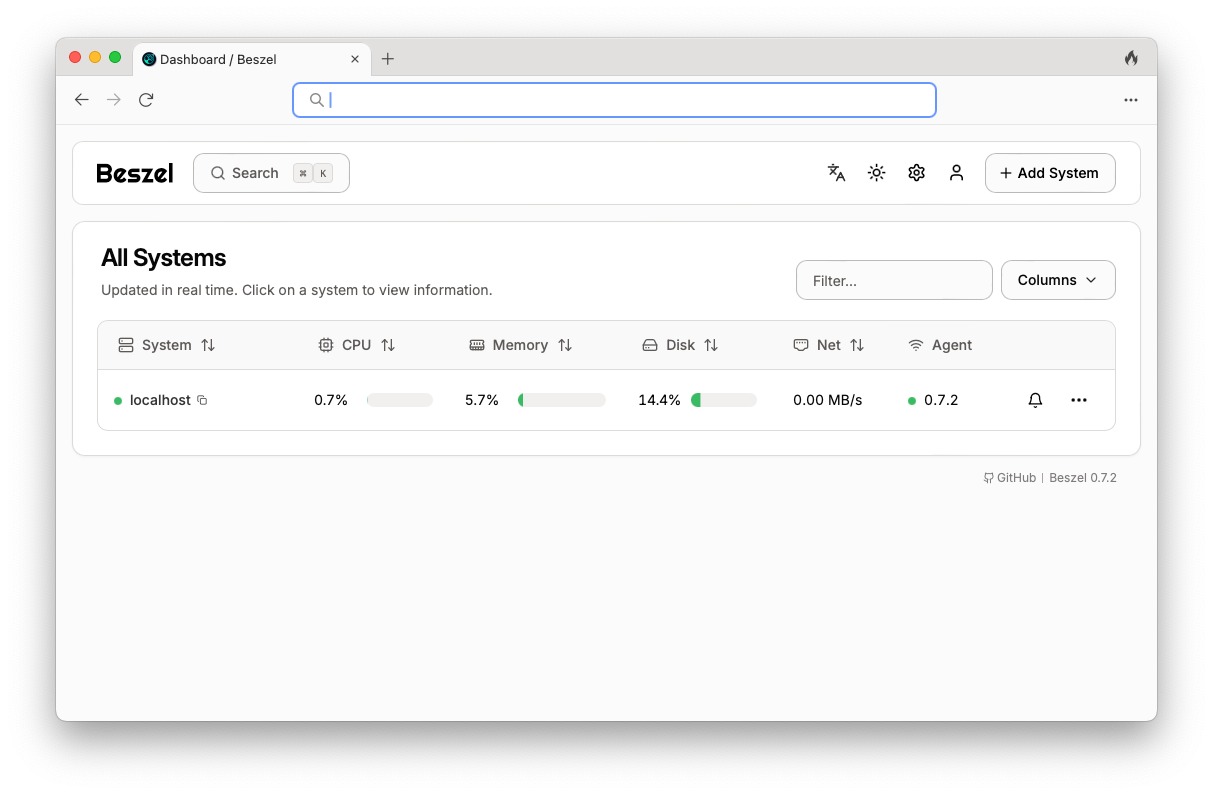
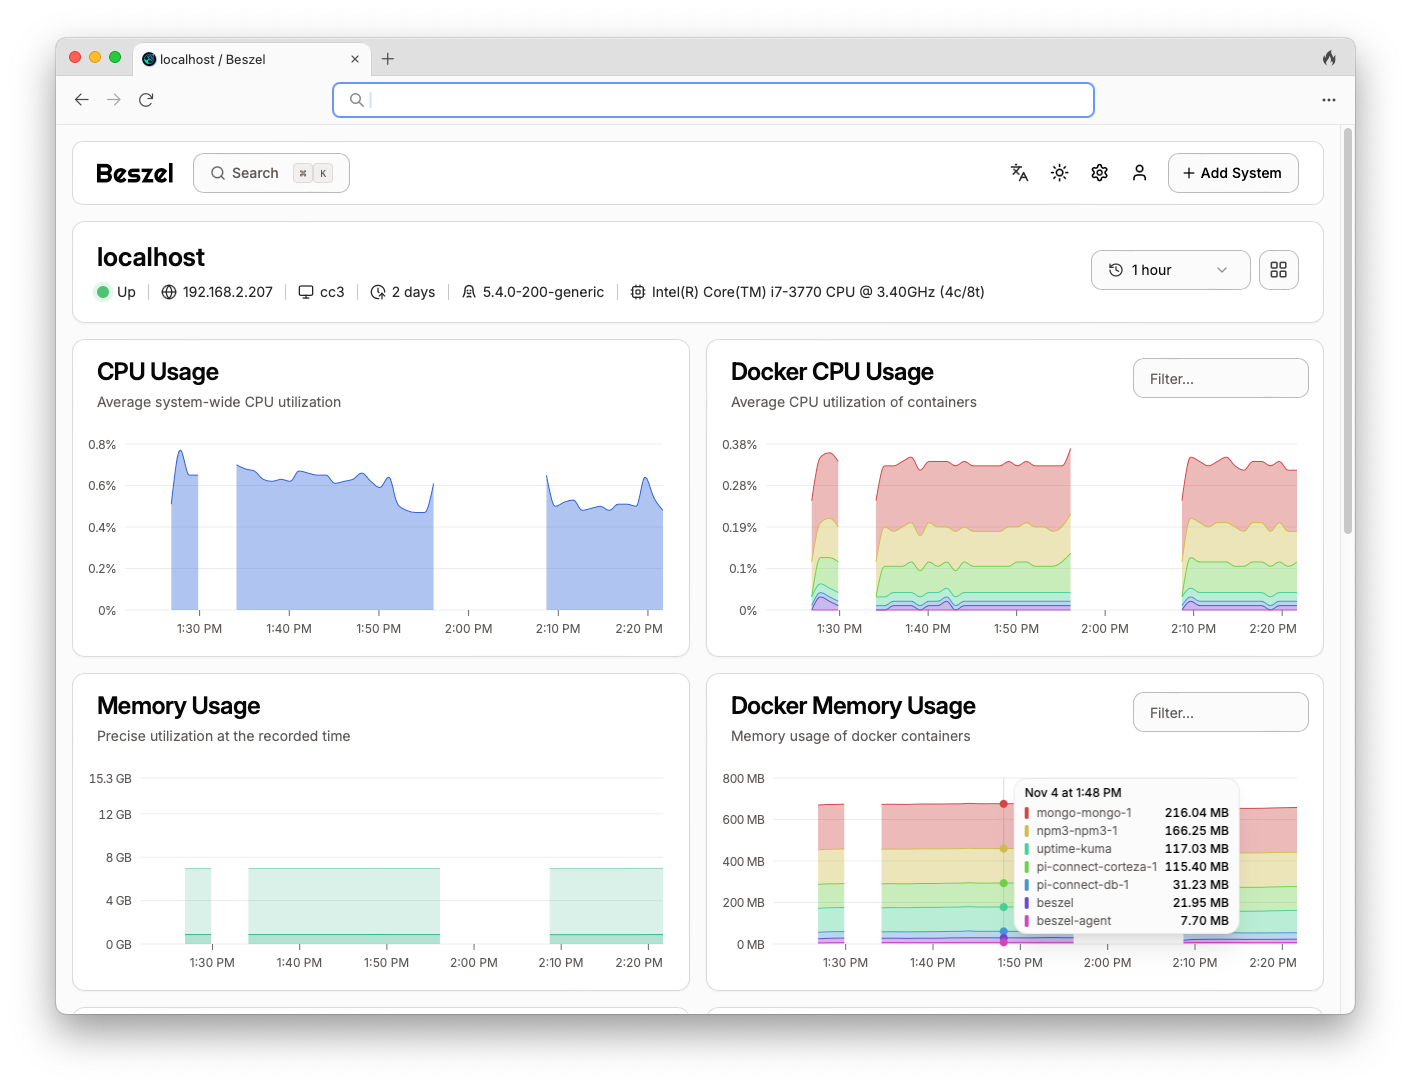
Hover to Docker Memory Usage reveals more detailed info for each container. Here I see Beszel and the agent are using about 30MB, but Uptime Kuma and Nginx Proxy Manager each uses well above 100MB. The first one is MongoDB, which seems reasonable, and even the "large" app Corteza only takes about the the same memory. I guess I may have to come back and do something about it later.
I know that Beszel is still new. I cannot see more detailed info inside each container such as the processes, but it is sufficient for me right now.
